목표
Backend에 HPA 기반 오토스케일링
Prometheus + Grafana 기반 모니터링 대시보드 구성
GitHub Actions 기반 CI/CD 자동 배포 구축
최종 아키텍처
User
 ↓
Cloudflare Tunnel
 ↓
HTTPS
 ↓
Ingress
 ↓
Frontend
 ↓
Backend API
 ↓
Redis / PostgreSQL
 ↓
Prometheus / Grafana
 ↓
GitHub Actions CI/CD
남은 작업
-
HPA 오토스케일링 설정
- Backend Deployment에 HPA 적용
- CPU 기준 오토스케일링 설정
- scale out / scale in 동작 확인
-
모니터링 구성
kube-prometheus-stack설치- Prometheus + Grafana 대시보드 구성
- CPU / Memory / Pod 상태 / HPA 변화 시각화
-
CI/CD 구축
- GitHub Actions 워크플로우 작성
- 코드 Push 시
- Docker 이미지 빌드
- Docker Hub push
- Helm upgrade 자동화
HPA Auto Scaling
HPA → Deployment 같은 워크로드의 Pod 개수를 자동으로 늘리거나 줄여줌
구조
Pod -> kubelet -> metrics-server -> Metrics API -> HPA controller -> Deployment replicas 조정
- Backend Deployment에 requests/limits 가 반드시 필요
- 현재 사용량 / requested CPU 비율 기준 계산
- metrics-server 이 있는지 확인
kubectl get deployment -A | grep metrics-server
kubectl get apiservice | grep metrics.k8s.io
kubectl top nodes
kubectl top pods -n game
-
kubectl top: metrics-server 있어야 동작 -
처음에 미리 설치 완
- Backend Deployment resources 부분
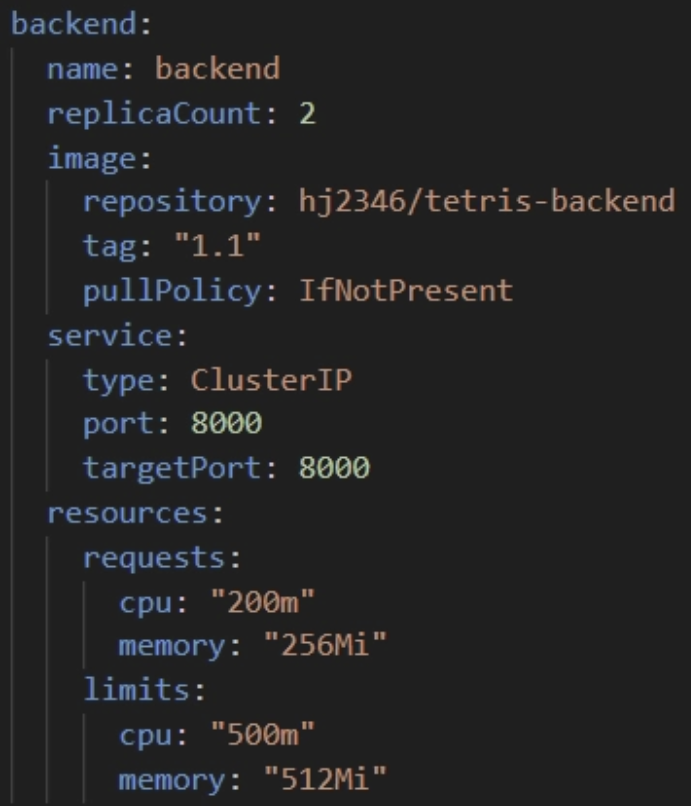
values.yaml에 작성 완
- HPA 매니페스트 작성
-
autoscaling/v2추천 -
Deployment/StatefulSet 대상 replicas 조정
-
기존
minReplicas: 1→minReplicas: 2로 변경- 가용성 목적
- Helm Chart에 HPA 추가
-
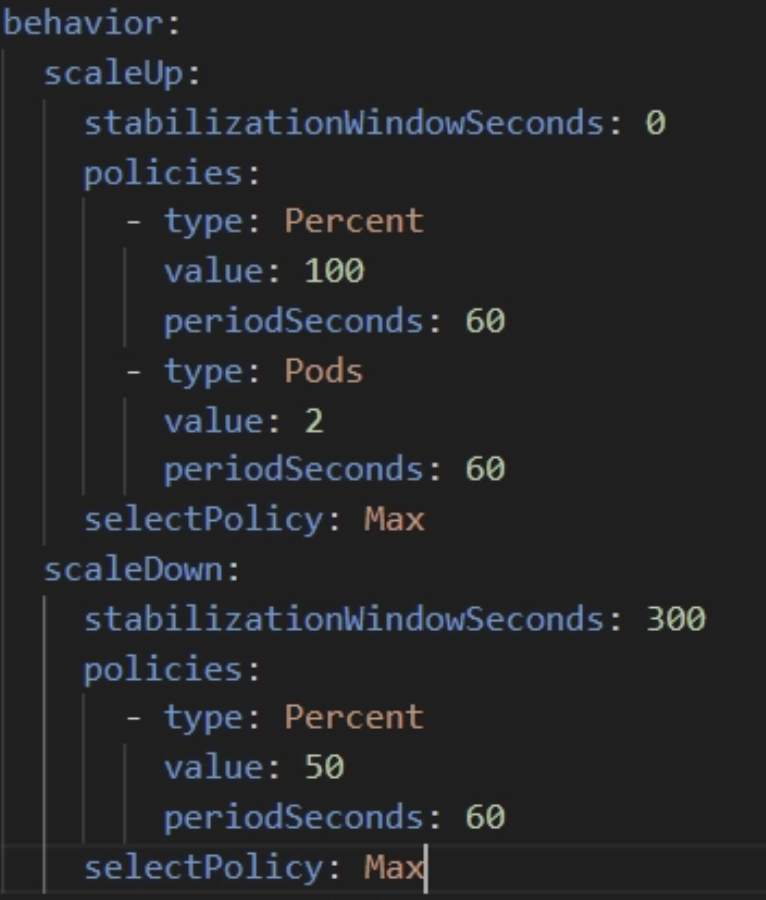
backend-hpa.yaml로 작성 완 -
behavior 추가
배포 전 렌더링 확인 :
helm lint ./charts/game
helm template game ./charts/game -n game
helm lint,helm template --debug,helm install --dry-run --debug로 템플릿 검증- 기본 디버깅 방법
적용 : helm upgrade --install tetris ./helm/tetris -n game
확인 : kubectl get hpa -n game

Tip
HPA 대상 Pod에 liveness/readiness probe 설정 필
CPU request를 너무 작게 잡기 X
부하 테스트는 Backend Service 주소 기준
Kubernetes 모니터링
크게 두 층
- 클러스터 계층
→ Node 상태, Pod 상태, CPU / Memory / Network, HPA / Deployment 상태- 애플리케이션 계층
→ FastAPI 응답 시간, 에러율, Redis / PostgreSQL 성능, 요청량
kube-prometheus-stack사용- Prometheus Operator 중심
- Prometheus, Alertmanager, Grafana, exporters, rules, dashboards 묶은 차트
kube-prometheus-stackHelm 설치
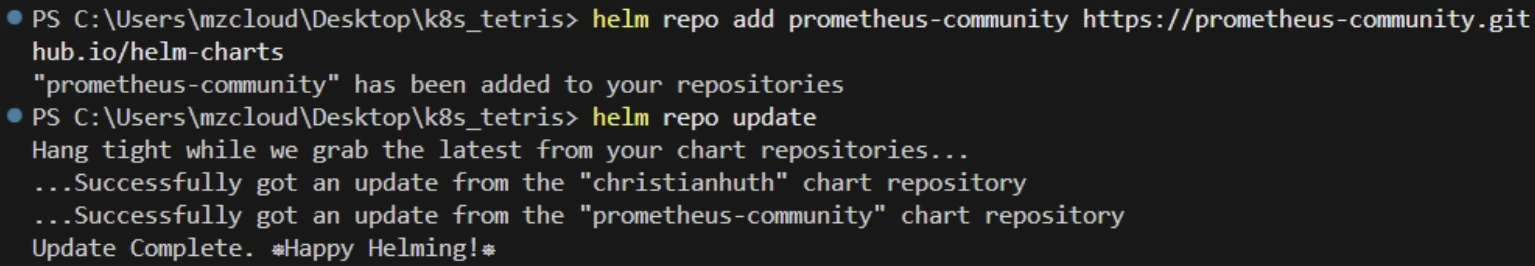
Helm repo 추가 :
helm repo add prometheus-community https://prometheus-community.github.io/helm-charts
helm repo update
네임스페이스 생성 :
kubectl create namespace monitoring

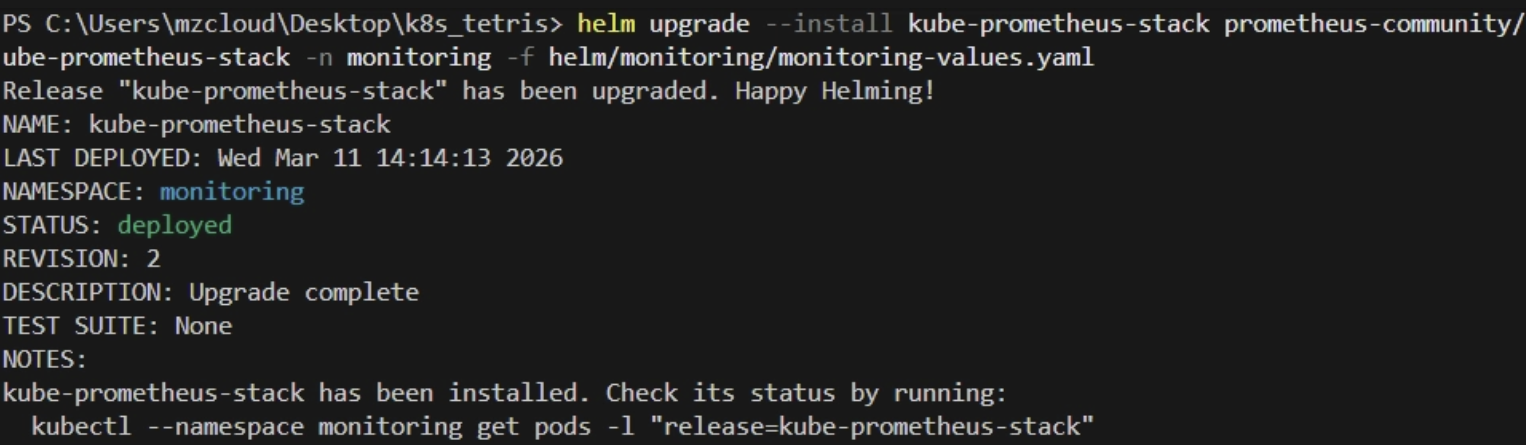
설치 :
helm upgrade --install kube-prometheus-stack prometheus-community/kube-prometheus-stack \
  -n monitoring
- Prometheus Operator 기반
- Prometheus / Grafana / Alertmanager / 기본 규칙과 대시보드 포함
values.yaml수정
- 로컬 VM 환경 persistent volume과 서비스 노출 방식 명확히
grafana:
  adminUser: admin
  adminPassword: strong-password
  service:
    type: ClusterIP
  persistence:
    enabled: true
    size: 5Gi

prometheus:
  prometheusSpec:
    retention: 15d
    storageSpec:
      volumeClaimTemplate:
        spec:
          accessModes: ["ReadWriteOnce"]
          resources:
            requests:
              storage: 20Gi

alertmanager:
  alertmanagerSpec:
    storage:
      volumeClaimTemplate:
        spec:
          accessModes: ["ReadWriteOnce"]
          resources:
            requests:
              storage: 5Gi
적용 :
helm upgrade --install kube-prometheus-stack prometheus-community/kube-prometheus-stack \
  -n monitoring -f monitoring-values.yaml
values.yaml관리할 때 경로 설정
기본적으로 경로설정이 다름
- 차트 경로 :
helm upgrade --install <release명> <chart경로> - values 파일 경로 :
-f <values파일경로>
상태 확인 :
kubectl get pods -n monitoring
kubectl get svc -n monitoring
Prometheus 구조 요약
- Exporter / kube-state-metrics / node-exporter / kubelet → 메트릭 노출
- Prometheus → scrape
- Prometheus TSDB 저장
- Grafana → Prometheus 데이터 소스로 조회
- Alertmanager → 알림
kube-prometheus-stack =
prometheus-operatorprometheus→ 수집/저장alertmanagergrafana→ 시각화kube-state-metrics→ Deployment, Pod, HPA, StatefulSet 같은 Kubernetes object 상태node-exporter→ 노드 CPU / Memory / Disk- 포함
if) PVC가 Pending <10_troubleshooting - 문제 8 참고>
local-path-provisioner
-
각 노드의 로컬 디렉터리를 이용해 동적 프로비저닝 해주는 가벼운 스토리지 프로비저너
-
PVC 생성 시 해당 노드에
hostPath또는local기반 PV를 자동으로 만들어 바인딩 함 -
local-path-provisioner 설치해서 동적 볼륨 프로비저닝 붙임
현재 StorageClass 와 PVC 상태 확인
kubectl get storageclass
kubectl get pvc -n monitoring
local-path존재 유무, default 여부 확인
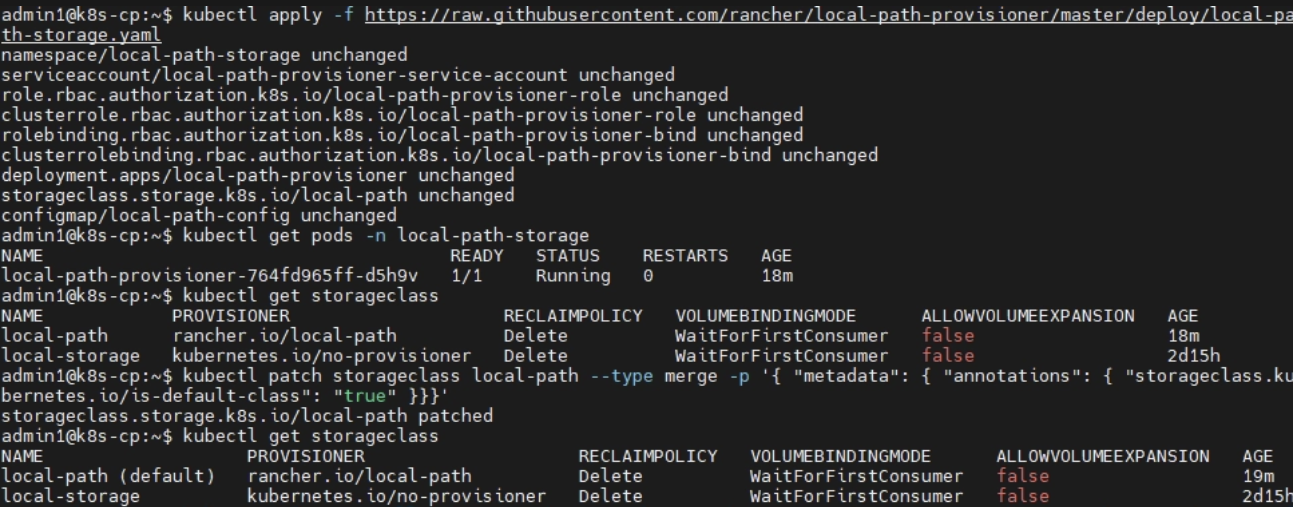
설치 :
kubectl apply -f https://raw.githubusercontent.com/rancher/local-path-provisioner/master/deploy/local-path-storage.yaml
local-path-storage네임스페이스, 프로비저너 Deployment, ConfigMap, RBAC, StorageClass를 함께 생성
확인 :
kubectl get pods -n local-path-storage
kubectl get storageclass
- 기본 StorageClass로 지정할지 결정
local-path를 기본 StorageClass 로 지정 시 → 앞으로storageClassName을 따로 작성하지 않은 PVC도 자동으로local-path사용하게 됨
kubectl patch storageclass local-path -p '{"metadata": {"annotations":{"storageclass.kubernetes.io/is-default-class":"true"}}}'
-
확인 :
kubectl get storageclass→local-path옆{default}붙으면 성공 -
monitoring에만 사용할 것이기에 default로 만들지 않고
values에서storageClassName: local-path명시하는 것으로 대체
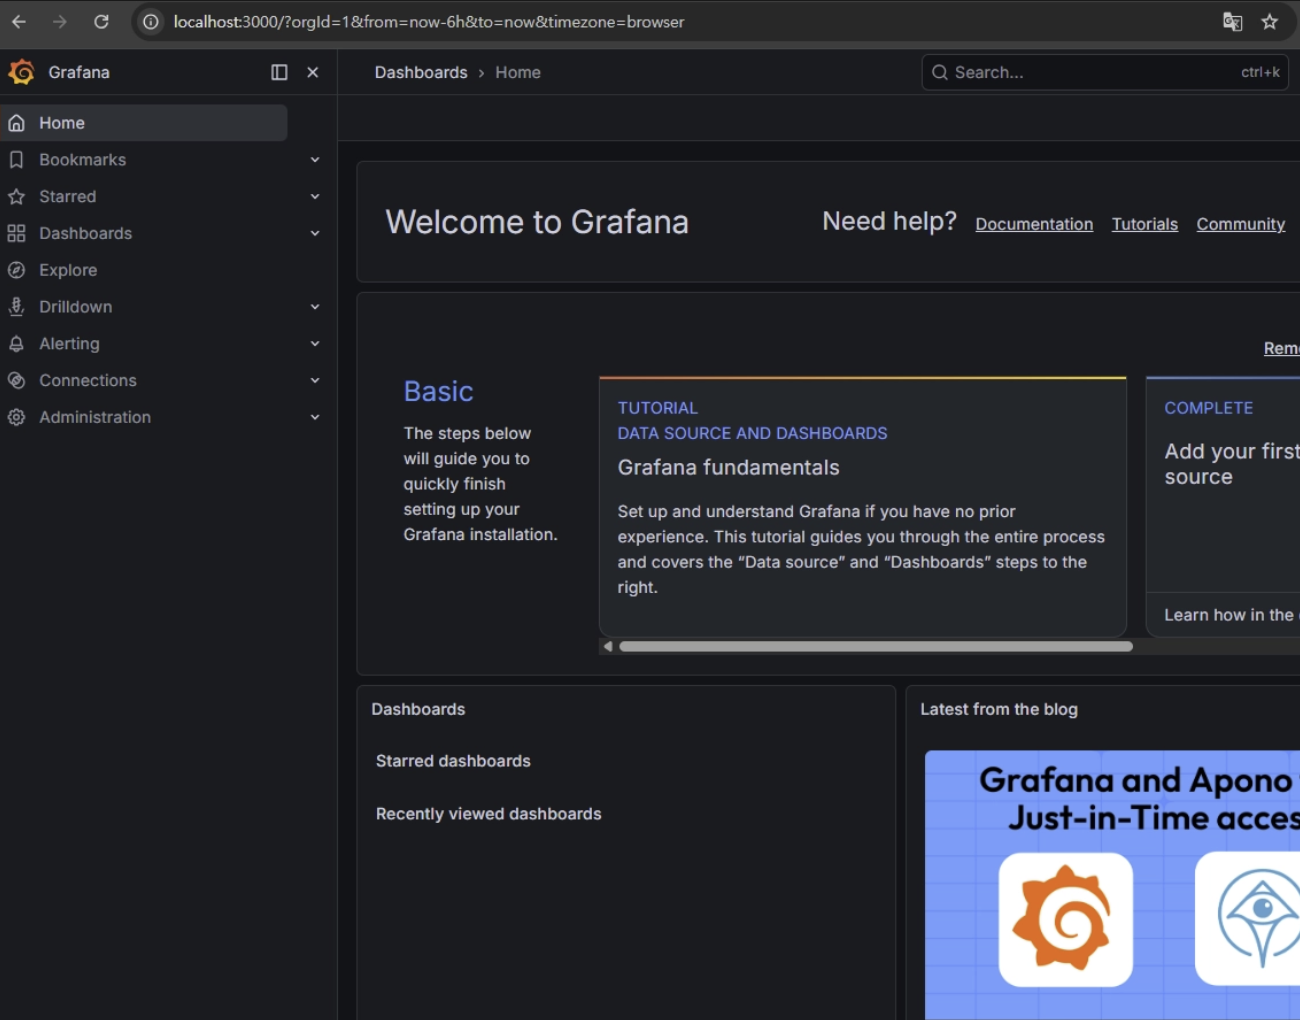
- Grafana 접속
- 접속하는 다양한 방식 존재
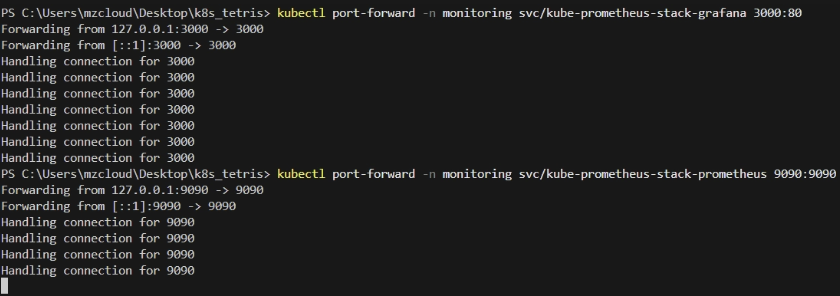
- 포트포워딩 사용
kubectl port-forward -n monitoring svc/kube-prometheus-stack-grafana 3000:80
이후 브라우저 접속 : http://localhost:3000
- 로그인 계정은 설치 시 넣은
adminUser,adminPassword사용
if) Password 를 values로 안넣었으면 Secret 확인
kubectl get secret -n monitoring kube-prometheus-stack-grafana -o jsonpath="{.data.admin-password}" | base64 -d
echo
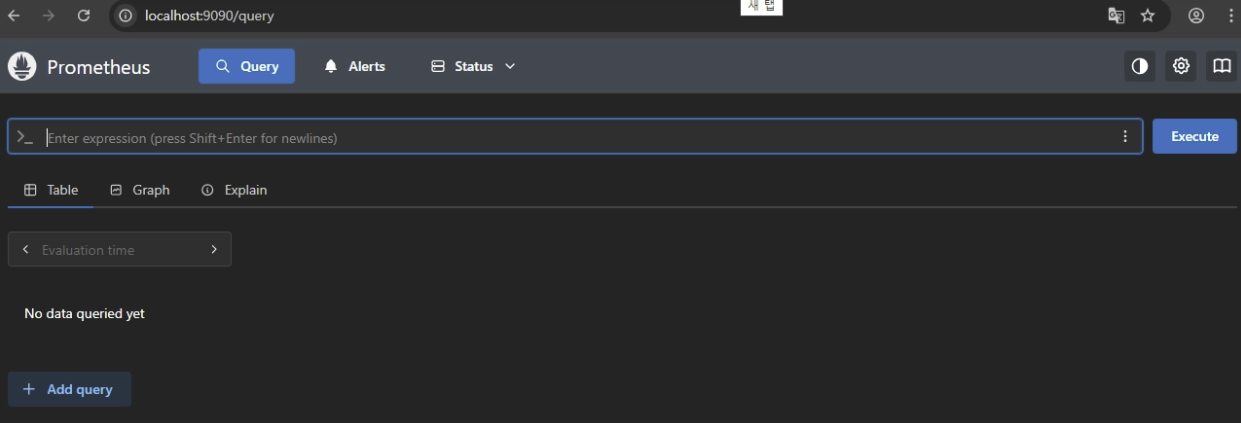
Prometheus 접속 :
kubectl port-forward -n monitoring svc/kube-prometheus-stack-prometheus 9090:9090
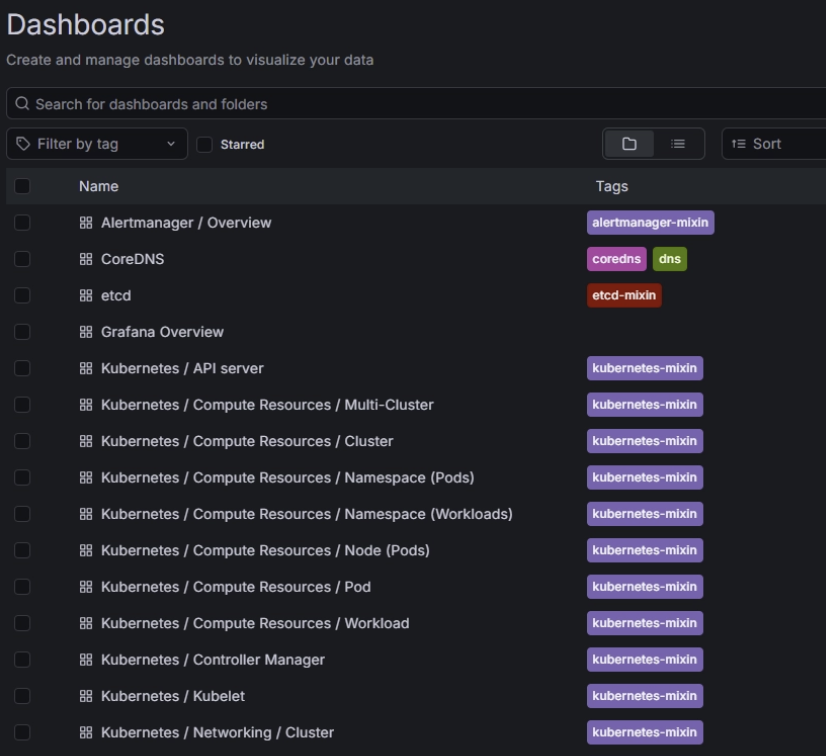
Kubernetes 기본 대시보드
Grafana 로그인 후 확인 가능 대시보드 :
- Kubernetes / Compute Resources / Node, Pod, Namespace (Pods)
- Kubernetes / Networking, API server
- Kubernetes / Views / Nodes, Pods
위 대시보드로
- 노드 별 CPU / Memory 사용량
- 네임스페이스 별 Pod 사용량
- 특정 Pod의 CPU / Memory 추이
- 재시작 횟수
- Pending / CrashLoopBackOff 여부
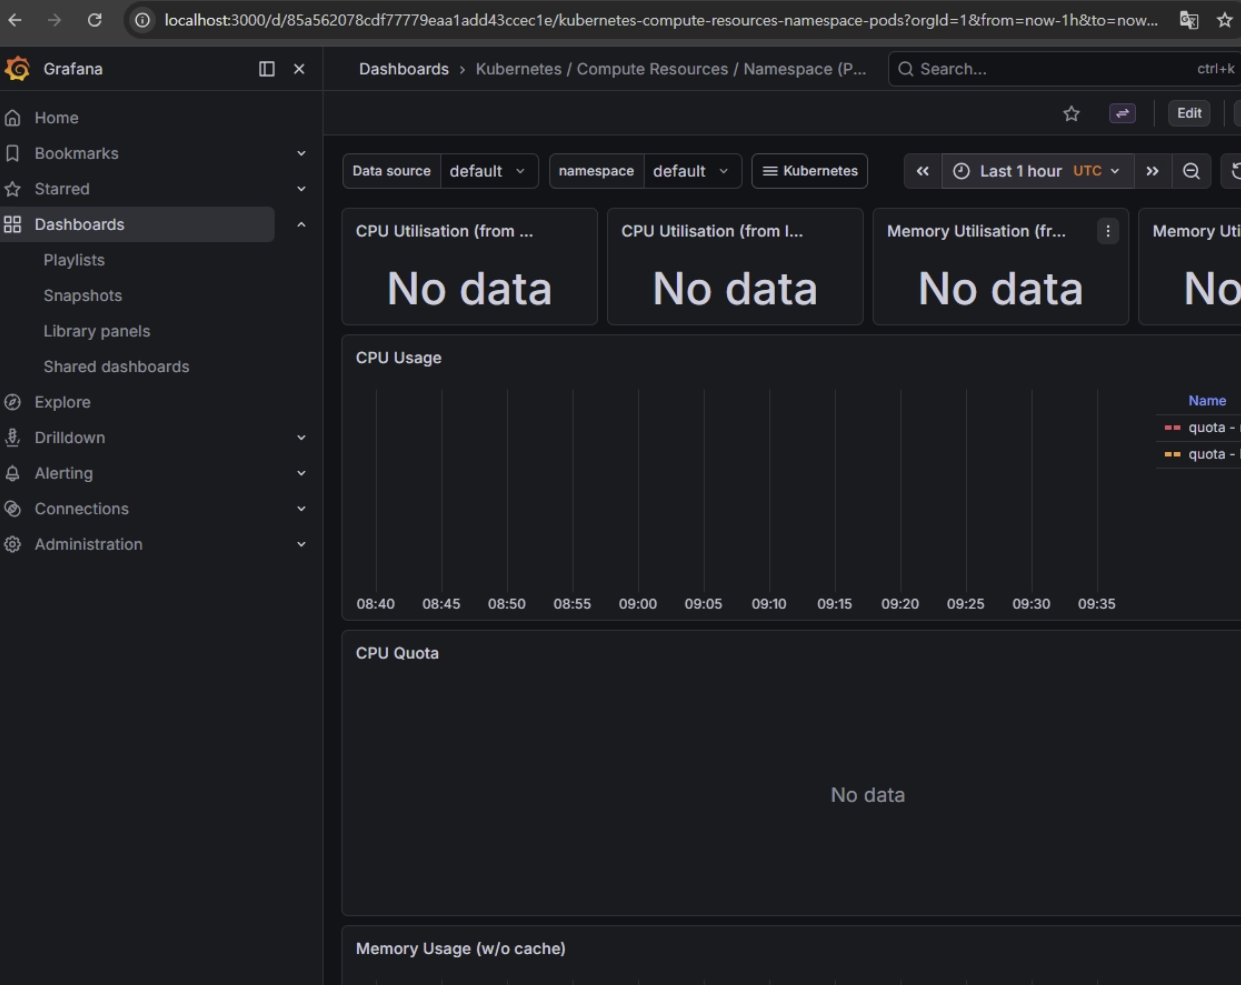
- 현재 생성 직후라 수집된 지표가 없으나 잠시 기다리면 지표가 나오기 시작함
- 테스트
-
Pod / Node 모니터링
- Grafana에서 Node 대시보드 열기
- Worker Node 2대의 CPU / Memory 그래프 확인
gamenamespace의 Pod 그래프 확인
-
HPA / CPU / Memory 모니터링
- 기본 대시보드로도 확인은 가능
- HPA 상태는
kube-state-metrics기반 메트릭으로 패널 생성이 권장
sum(rate(container_cpu_usage_seconds_total{namespace="game", pod=~"game-backend.*"}[2m])) by (pod)
sum(container_memory_working_set_bytes{namespace="game", pod=~"game-backend.*"}) by (pod)
kube_deployment_status_replicas{namespace="game", deployment="game-backend"}
kube_horizontalpodautoscaler_status_current_replicas{namespace="game", horizontalpodautoscaler="game-backend-hpa"}
kube_horizontalpodautoscaler_status_desired_replicas{namespace="game", horizontalpodautoscaler="game-backend-hpa"}
이외 권장 사항
- Prometheus / Grafana PVC 사용
- 모니터링은
monitoringnamespace 분리 - Grafana는 처음엔 port-forward, 이후 Cloudflare Tunnel 뒤에서 Ingress 노출
- Alertmanager는 이후 Slack/Discord/Webhook 알림 연결
GitHub Actions 기반 CI/CD
흐름
- GitHub repo의
main브랜치에 push - GitHub Actions가 Docker 이미지 build
- Docker Hub push
- 같은 워크플로에서 kubeconfig를 사용해 클러스터 접속
helm upgrade --install실행image.tag변경으로 Backend Deployment 롤링 업데이트 발생kubectl rollout status로 성공 여부 확인
특징
- 이미지 태그만 변경되어도 Deployment의 Pod template 변경으로 롤링 업데이트 유도
- GitHub Actions의 secret 기능으로 민감정보 저장
- Docker Hub 인증은 비밀번호 대신 토큰 사용
- Helm은
helm upgrade에서-f또는--set으로 값을 덮어쓸 수 있음 - 배포 완료 여부 :
kubectl rollout status로 확인
핵심
latest대신 고정 태그 사용
태그는github.sha같은 커밋 단위 값 사용
Helm에서image.repository/image.tag를 외부 주입해서 배포
설정 방식 (세가지 방법)
- GitHub Actions → 직접 배포
구조
GitHub Actions
      │
      ▼
Kubernetes API
장점
- 구현 쉬움
- 빠르게 구축 가능
단점
-
API server 외부 노출
-
kubeconfig secret 위험
-
조건
- GitHub-hosted runner가 Kubernetes API서버에 네트워크로 접근 가능해야 함
- kubeconfig를 GitHub Secret으로 안전하게 관리해야 함
설정 방법
-
GitHub Secrets
- Repository 생성 후 GitHub 연결
- GitHub Secrets 에 해당 값 + a 넣기
DOCKERHUB_USERNAMEDOCKERHUB_TOKENKUBECONFIG_B64HELM_RELEASE=tetris-backend(선택)K8S_NAMESPACE=tetris(선택)
-
Docker Hub Token
- GitHub Actions에서 Docker Hub 로그인 시 계정 비밀번호 사용 X
- → Personal Access Token 사용
-
kubeconfig
- Control Plane에서 사용하는 kubeconfig → base64로 인코딩 해 secret에 넣음
base64 -w 0 ~/.kube/config→KUBECONFIG_B64로 저장
- Self-hosted runner
구조
GitHub
   │
   │ trigger
   ▼
Self-hosted Runner (inside cluster / VM)
   │
   ▼
Kubernetes API
-
runner을 클러스터 내부 VM에 위치
- ex)
Control Plane VM,Worker VM,CI Runner VM
- ex)
-
→ CI runner만 내부에서 접근
- GitOps
도구 : ArgoCD , Flux
구조
GitHub
   │
   ▼
Git Repo
   │
   ▼
ArgoCD (cluster 내부)
   │
   ▼
Kubernetes
-
GitHub → Kubernetes 직접 접근 없음
-
ArgoCD가 git을 계속 pull 함
-
보안상 세 가지 방법 중 가장 좋음
-
GitOps : Git 저장소 기반 Kubernetes 상태를 Git과 자동으로 동기화
- Git = 원하는 상태 / Kubernetes = 실제 상태
- ArgoCD 같은 GitOps 도구가
Git 상태 == Cluster 상태맞춤
-
ArgoCD : Git Repo 상태를 Kubernetes cluster와 자동 동기화 하는 GitOps 컨트롤러
- Kubernetes 안에서 실행되는 Controller
- 과정
- Git repo watch
- 변경 감지
- Helm / Kustomize render
- Cluster 상태와 비교
- 차이 있으면 sync
- 주요 기능
- Continuous Deployment :
git push→ 자동 배포 - Drift Detection :
kubectl로 수동 변경하면 Git과 다른 상태 감지 - Self Healing : Git 상태로 자동 복구
- UI 제공 : Pod, ReplicaSet, Service, ConfigMap 전체 상태 확인 가능
- Continuous Deployment :
실제 설정 (GitOps)
흐름
Developer
    │
    │ git push
    ▼
GitHub (application code)
    │
    │ Docker build
    ▼
Docker Hub
    │
    │ image tag update
    ▼
GitOps Repo (Helm values)
    │
    ▼
ArgoCD
    │
    ▼
Kubernetes Cluster
- CI = image build / CD = ArgoCD
- ArgoCD 설치
namespace 생성 : kubectl creat namespace argocd
설치
kubectl apply -n argocd \
-f https://raw.githubusercontent.com/argoproj/argo-cd/stable/manifests/install.yaml
- 최근 Kubernetes CRD가 커져 용량 제한 초과 걸림 →
--server-side옵션으로 해결 - if) 이전
Client-side랑 Conflict 날경우 →--force-conflicts옵션으로 해결
Pod 확인 : kubectl get pods -n argocd
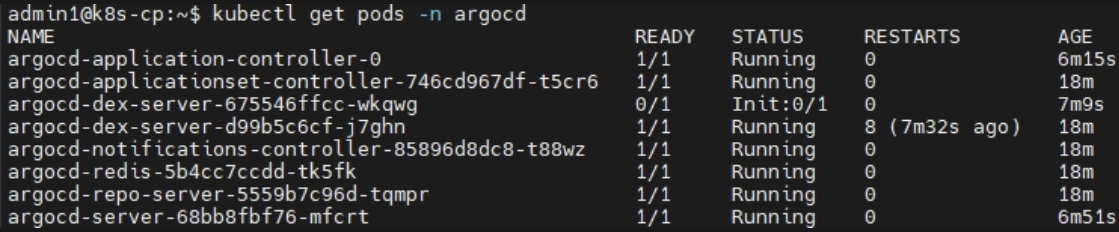
<문제 9.> - 오류 발생 시 해결
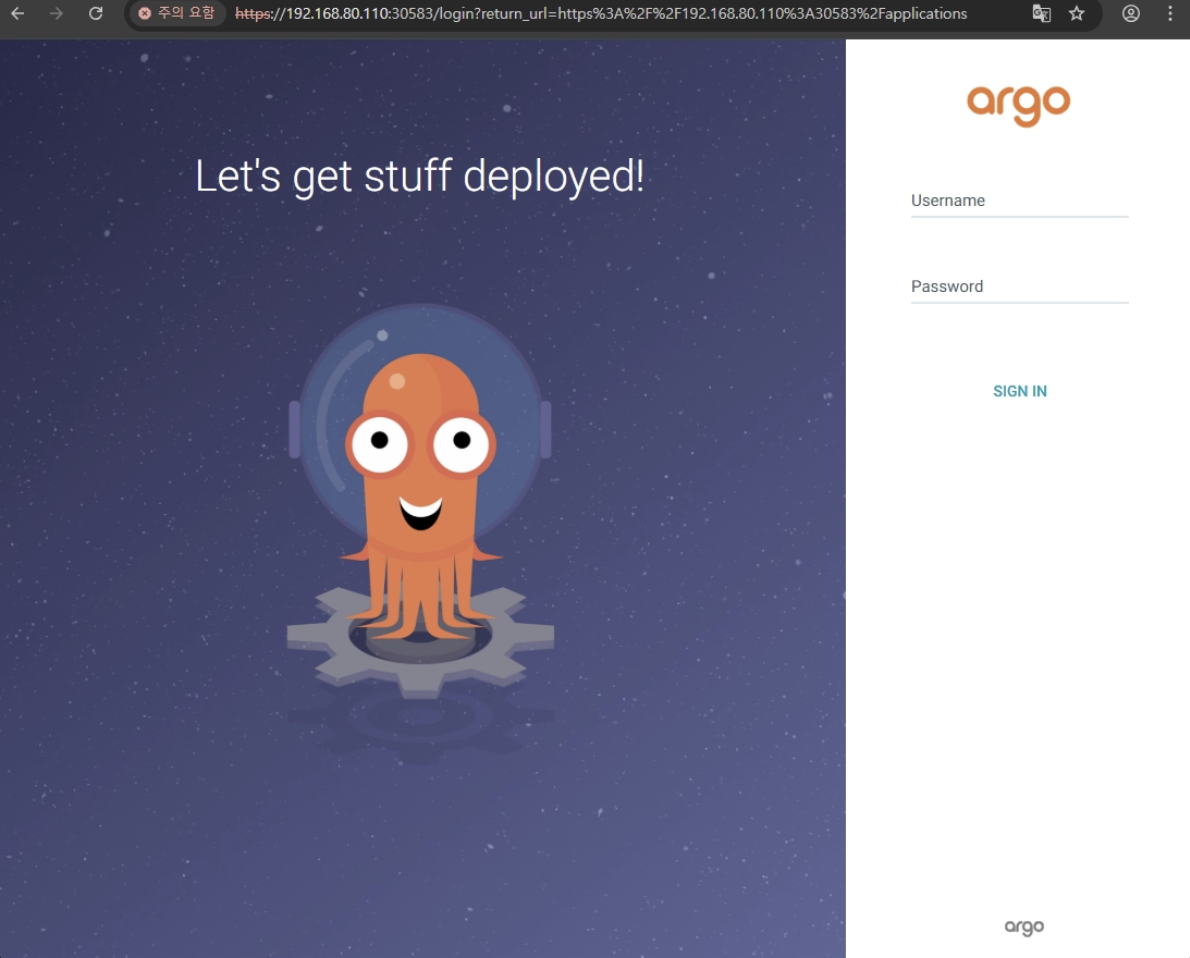
- ArgoCD 접속
Service 확인 : kubectl get svc -n argocd
- 보통
ClusterIP→NodePort로 변경 (`kubectl patch svc argocd-server -n argocd -p ’{“spec”: {“type”: “NodePort”}}’)
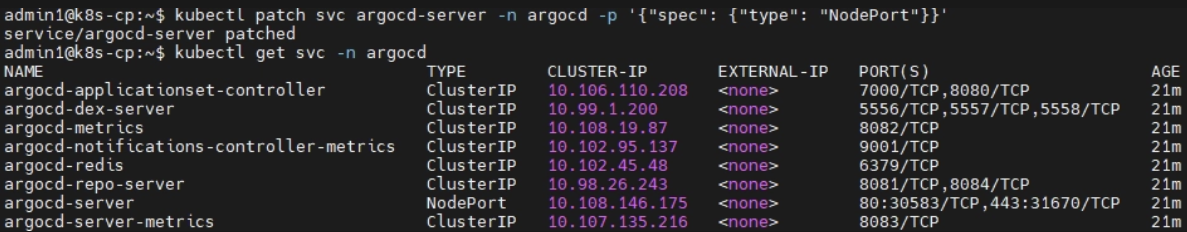
접속 : https://<node-ip>:<nodePort>
초기 admin password 확인
kubectl get secret argocd-initial-admin-secret \
-n argocd \
-o jsonpath="{.data.password}" | base64 -d
- id =
admin/ pw =<해당 값>으로 접속
- Git Repo
- ArgoCD는 배포 상태 관리 (코드 관리 X) → 앱 코드 repo / 배포 repo 나눔
- ArgoCD는
- Kubernetes manifest
- Helm chart
- Helm values
- Kustomize 을 봄
- ArgoCD는
ex) app code repo
- backend source
- frontend source
- Dockerfile
배포 repo
-
Helm chart
-
values.yaml
-
image tag
-
ingress
-
namespace
-
일단 monorepo로 사용 → path 설정 필요
- cp에서
tetris-app.yaml생성
apiVersion: argoproj.io/v1alpha1
kind: Application
metadata:
  name: tetris
  namespace: argocd

spec:
  project: default

  source:
    repoURL: https://github.com/repo주소
    targetRevision: main
    path: helm/tetris

  destination:
    server: https://kubernetes.default.svc
    namespace: game

  syncPolicy:
    automated:
      prune: true
      selfHeal: true
- Kubernetes 안에 Application 리소스 생성
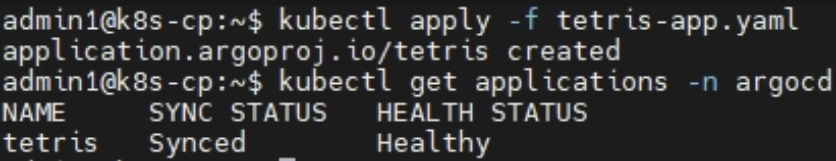
적용 : kubectl apply -f tetris-app.yaml
확인 : kubectl get applications -n argocd
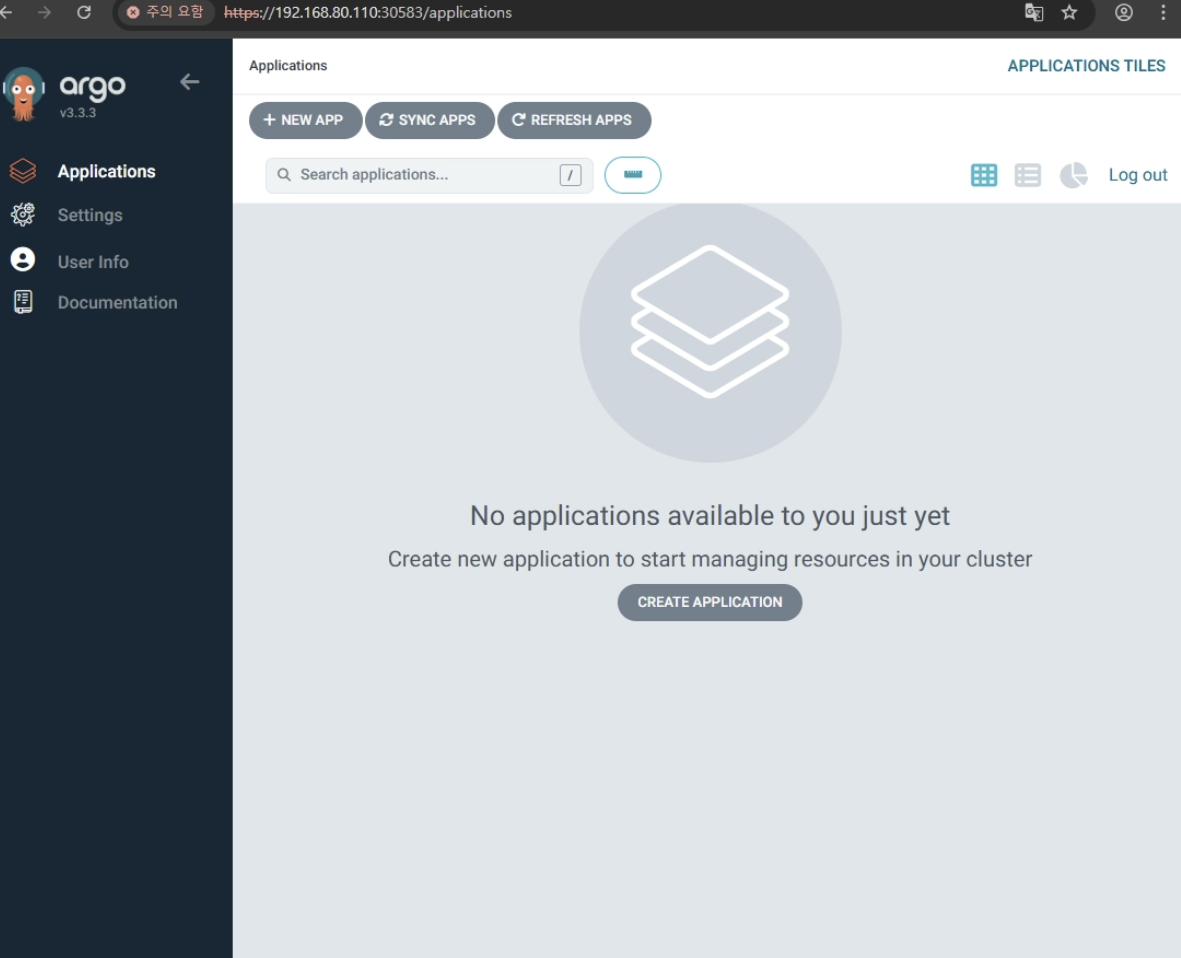
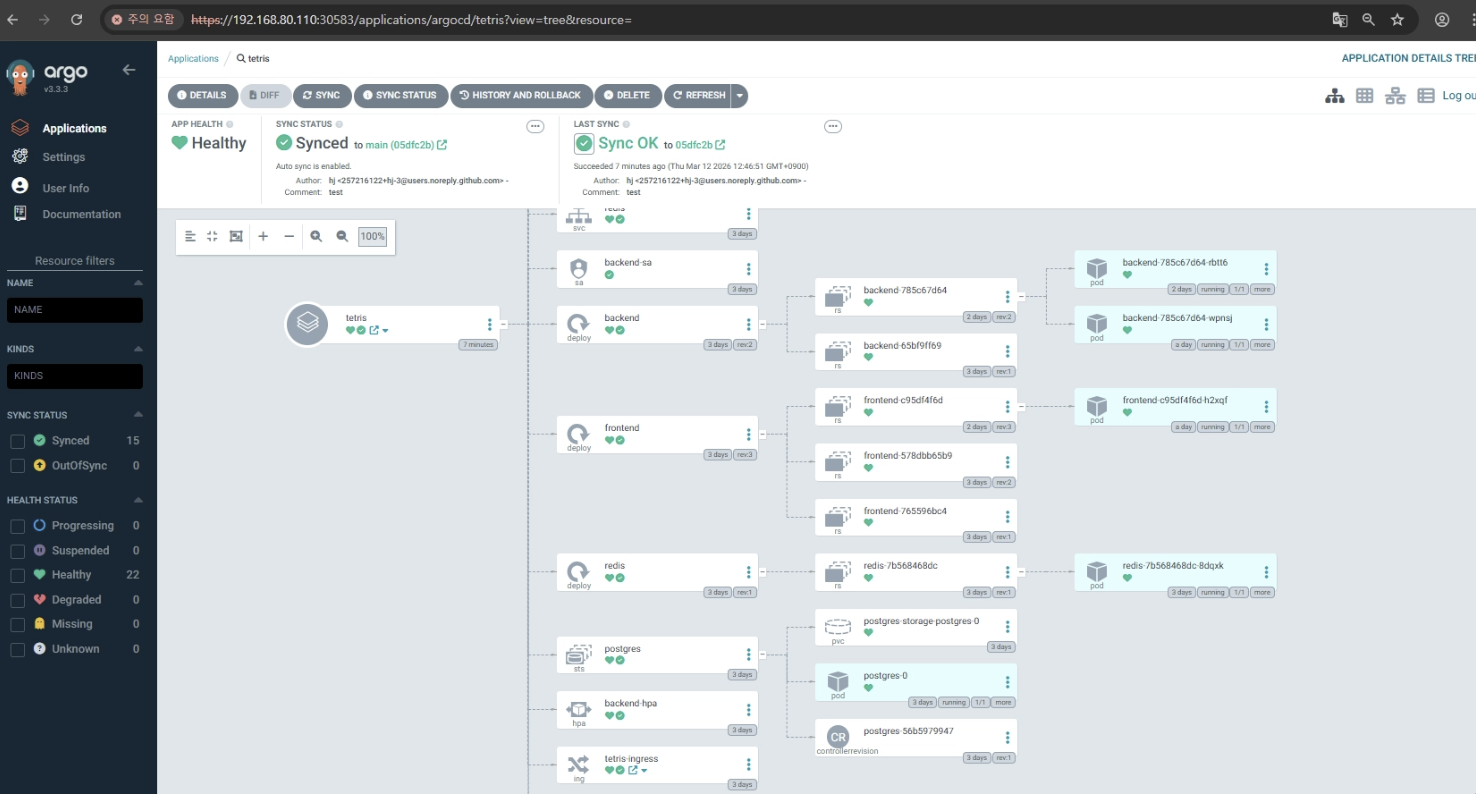
- ArgoCD 웹 UI 에서도 확인 가능
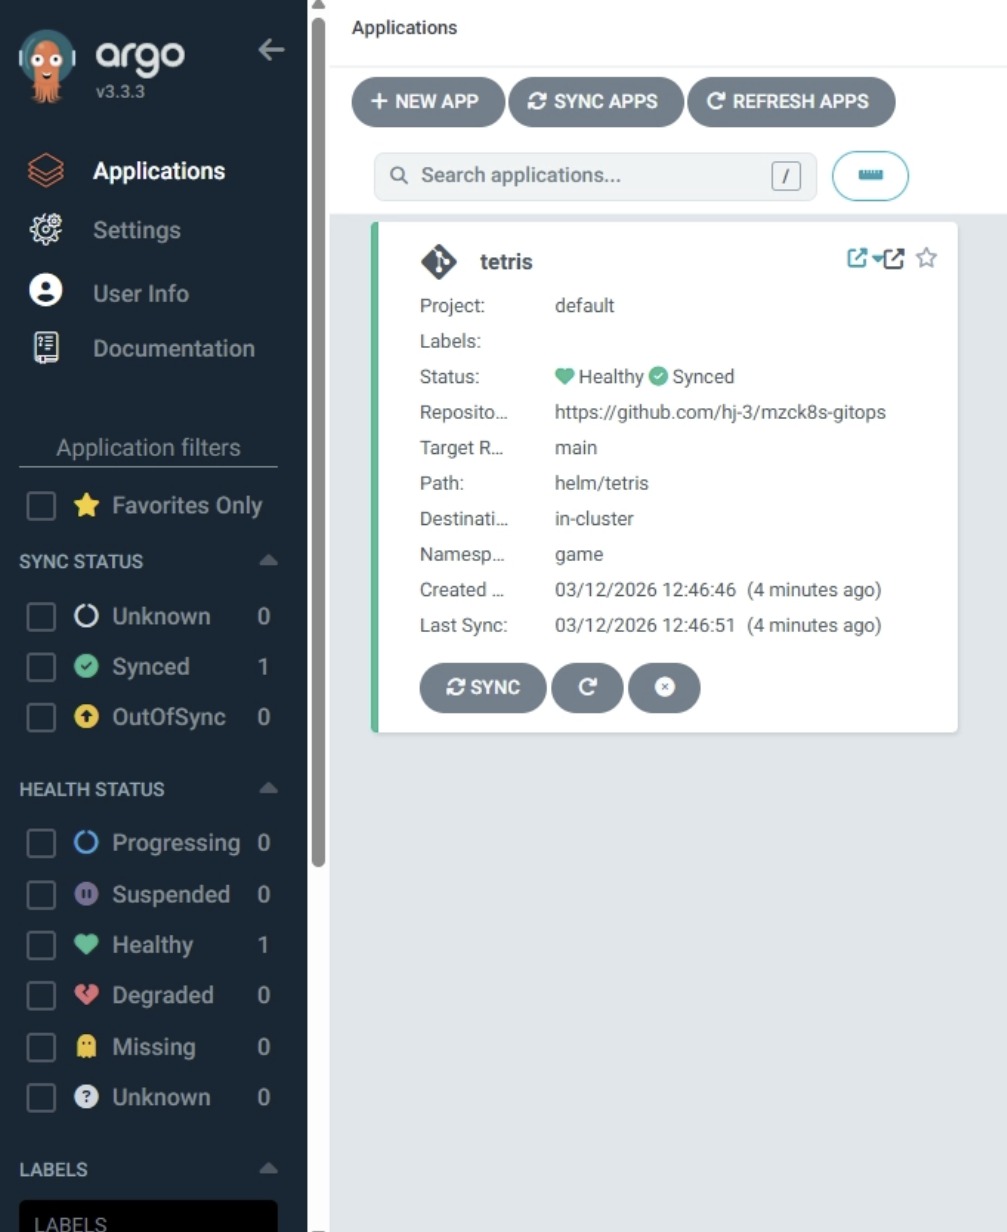
- 자동 배포 동작
.syncPolicy.automated가 켜져있으므로,helm/tetris아래values파일에서 이미지 태그를 변경하고 Git push 하면 ArgoCD가 변경을 감지하여 자동으로 sync
Docker 이미지 push
→ helm/tetris 안의 image tag 수정
→ git push
→ ArgoCD 감지
→ Kubernetes 롤링 업데이트
결과
backend/,frontend/코드 변경- Docker 이미지 build
- Docker Hub push
helm/tetris/values.yaml에서 이미지 태그 수정- commit / push
- ArgoCD가 감지해서 배포
[앱 코드 repo]
backend / frontend 코드
        │
        ▼
GitHub Actions
- Docker build
- Docker Hub push
- 배포용 values.yaml의 image tag 변경
        │
        ▼
[GitOps repo]
helm/tetris/values.yaml
        │
        ▼
ArgoCD
- Git 변경 감지
- Kubernetes 배포
- 앱 코드 변경 감지 + Docker 이미지 빌드/푸시 → GitHub Actions
- 배포 상태 변경 감지 + Kubernetes 반영 → ArgoCD